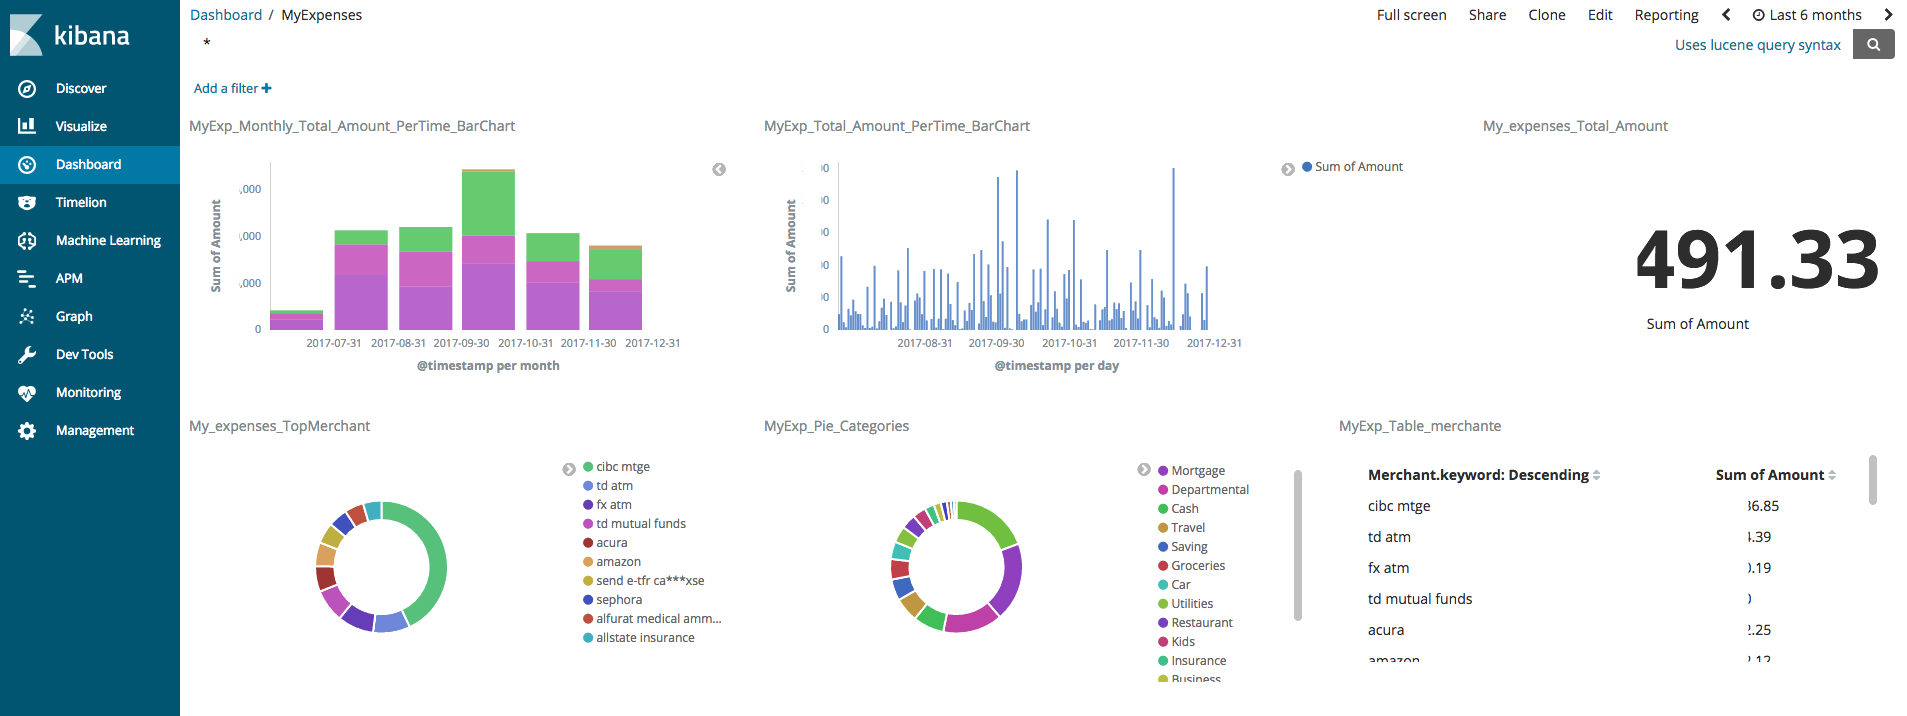
I was looking for a way to analyze my spending from all financial accounts in one place with the ability to visualize them and be able to search any transaction I did from any merchant or category with a few clicks. Simultaneously, I wanted to have full control and flexibility on how to slice and dice the data and categorize spending for business and personal use.
With my strong passion for using Elastic Stack and since I already have it running in my lab, I went down that route. Don’t forget that it’s free and open source.
You can refer to my previous article here on how to get started with elastic.
Here are the steps I followed to achieve this:

Step 1: Getting the data:
Like any data analytics project, your first step is to get the data. In my case, I just exported all my statement transactions into CSV files.

Step 2: Organize the data
I made sure all CSV files had the same structure by rearranging the columns to follow this order:
"TransactionDate", "Amount", "RawMerchant", "TransactionCity", "Source"
Step 3: Combine CSV Files (optional)
Concatenate all CSV files into a single file. This is an optional step I did just to simplify the solution while I was testing it at the beginning. This step is not needed since logstash can process multiple CSV files.
for f in *.csv; do (cat "${f}"; echo) >> output.december.csv; done
Step 4: Clean and Enrich the data
I wrote a python script to clean, enrich and enhance the quality of my data. This script does three main things
- Group same merchant that appears under different names together.For example, Amazon appears as a different merchant in the different transactions. One time you see it as “Amazon *Marketplace CA” and another time as “Amazon.ca”. Therefore, I created an additional column in the CSV file to have the merchant for these two transactions as “Amazon”. I applied this logic to multiple merchants
- Modify the transaction date in all transactions to follow the same format “yyyy-mm-dd"I faced issues with logstash in not creating the correct timestamp when the original transaction date was in a different format in each CSV file. I decided to make the fix in the data source rather than worry about it in logstash.
- Add a new category field for the Merchants. This field was not provided by my banks, so I created my own dictionary to map the merchant into the right category. For example, the metro store as shown below will be mapped into Groceries category
Here is the final output format of the CSV file which will be parsed by logstash:
2017-11-16,225.99 ,Amazon.ca,AMAZON.CA,marriott,amazon,Departmental
2017-11-17,32.99 ,Amazon *Marketplce CA,WWW.AMAZON.CA,marriott,amazon,Departmental
2017-12-27,53.03,"METRO #332 MILTON, ON",,cibc,metro,Groceries
Step 5: Process the data (Logstash)
I wrote a logstash config file to process the csv files and feed it to elastic using this configuration file
input {
  file {
    path => "/usr/share/logstash/bin/*.csv"
    start_position => "beginning"
   sincedb_path => "/dev/null"
  }
}
filter {
  csv {
       columns => [
          "TransactionDate",
          "Amount",
          "RawMerchant",
          "TransactionCity",
          "Source",
          "Merchant",
          "Category"
        ]
      separator => ","
  }
  date {
       match => [ "TransactionDate", "MM/dd/yyyy","yyyy-MM-dd" ]
  }
  mutate {
                convert => {
                        "Amount" => "float"
                }
  }
}
output {
  elasticsearch {
    hosts    => [ 'elasticsearch' ]
    user     => 'elastic'
    password => 'changeme'
    index => "my-expenses"
}
stdout {}
}
Step 6: Visualize and Analyze the data (Kibana)
Build a Kibana dashboard that gives me a full visibility into all my accounts and transactions.

- Now I have total visibility for all my spending across all the accounts in one place.
- I can filter for a specific time range
- I can identify business vs personal expenses.
- Identify spending per category
Also now I can analyze and search all my transactions in no time. For example, with one click, I can see all my Amazon transactions overtime and I can drill down in each individual one if needed.

Conclusion
After finishing this project, I am thinking to take things to the next level of doing more automation if I can get my transactions using APIs.
The other point to mention here is that working with elastic and doing the coding was the easiest part, but cleaning the data where I spent most of the time which is the case most of the time in data analytics projects.


