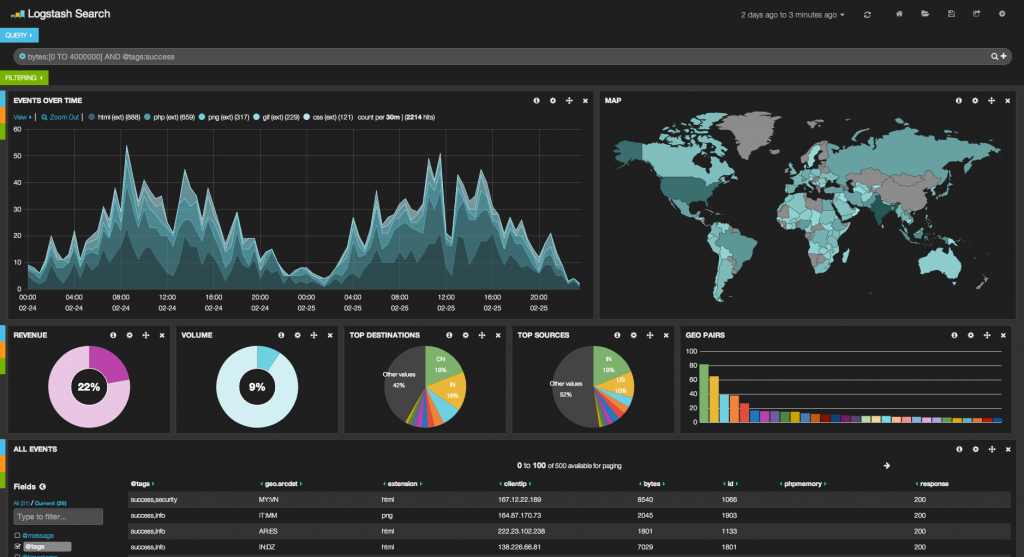
The purpose of this article is not for installing Elastic Stack for production. It’s to offer you a complete elastic stack sandbox environment to experiment with and learn from.
What’s Going To Be Done:
- Get Your Server OS Prepared
- Install Docker
- Install Elastic Stack (Elasticsearch, Logstash, and Kibana)
- Start Collecting and Analyzing Data With Elastic Stack
If this sounds complicated, it really isn’t. Once you get started, you are going to realize that it’s something you really can do in a matter of a few minutes. You will also receive a few instructions, for those of you with zero experience in AWS/Docker/Elastic.
NOTE: If you already have Docker installed, you may move on to Step 3 at this time.
Step 1: Get Your Server OS Prepared:
Launch a Linux instance on Amazon Web Services (AWS). I highly suggest this option because it will give you a great deal of flexibility to tinker around with your elastic environment from absolutely anywhere and you do not have to be at your computer. It will only take less than 5 minutes to have the Linux server up and running using AWS.
Here are the rules you need to define in the AWS security group

I highly recommend watching this YouTube video if you are not familiar with starting a new server instance using Amazon Web Services.
For you prefer, there is a Free one-year subscription that gives you the ability to run a smaller service, but I highly recommend you go with the t2.medium which will cost you $0.052 per hour. You will be billed on a one-hour basis of use. If your instance is stopped, you will not be charged for using it. To give you an example, I ran my instance for approximately 10 hrs. The chart below will show you actually what I was charged for that particular day ($0.62):

You can still use your own computer if you prefer but with all said and done, you still need to install Docker on an OS for this tutorial. It doesn’t matter whether it’s Mac, Windows or Linux. At this point, it’s time to move on to Step 2 for installing Docker.
Step 2: Install Docker
Docker offers an excellent step-by-step for installation. Instead of copying their page in these instructions, if you run into any problems, post it on the comment section. Below is the link for installing Docker (I recommend using Linux for this tutorial):
https://docs.docker.com/engine/installation/
Step 3: Install Elastic Stack
Option 1: (Quick and easy): just get the elastic docker image directly using docker pull command
docker pull opentica/elastic-stack
Option 2: Build the image yourself from the source Dockerfile
git clone https://github.com/opegeek/elastic-stack

cd elastic-stack/

docker build -t opentica/elastic-stack
Step 4: Start Collecting and Analyzing Your Data
Run The elastic docker container
docker run -p 5601:5601 -p 9200:9200 -p 5000:5000 -p 5044:5044 -it --name elastic opentica/elastic-stack
Start a new command window and ssh to the container
docker exec -it elastic /bin/bash
Start generating logs using the Java log-generator tool included in the image. This tool will generate sample log data that will be collected by logstash, stored in elasticsearch and presented in Kibana
cd log-generator/
java -jar target/log-generator-0.0.1-SNAPSHOT.jar -n 100 -r 1000 -t 2

Create a sample visulization using Kibana to present the generated data in previous step

Have fun with elastic!
Credits
I would like to give the credit to the owners of these repositories which I used to build my docker image.


2 thoughts on “Installing Elastic Stack and Start Analyzing Your Data in a Few Minutes”
Merely needed to say Now i’m happy that i came upon your page!|
I’m not sure where you are getting your info, but good topic.
I needs to spend some time learning much morre or understanding more.
Thanks for magnificent information I was looking for this information foor my mission.
Comments are closed.