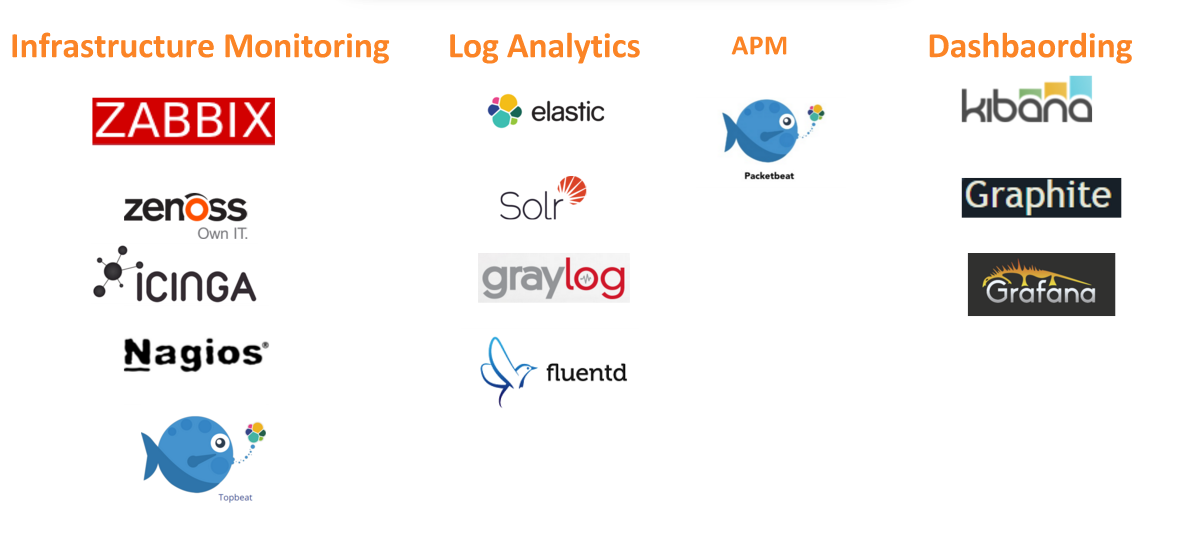
Test french Our top picks in open source monitoring tools covering Infrastructure, Network, Application, Analytics, and Dashboarding.
Infrastructure Monitoring
Have a look at Google Trend Analysis that shows interest over time for the top 4 open source infrastructure monitoring tools.

![]()
Enterprise-level software designed for monitoring availability and performance of IT infrastructure components. Zabbix is open source and comes at no cost that monitors performance and availability of servers, WEB applications, databases, networking equipment and more in your Data Center.
![]()
Nagios monitors your entire IT infrastructure to ensure systems, applications, services, and business processes are functioning properly. First launched in 1999, Nagios has grown to include thousands of projects and many plugins developed by the worldwide Nagios community. Nagios is officially sponsored by Nagios Enterprises. Nagios is a stable product, but can very difficult to set-up and maintain by unexperienced Nagios users.
![]()
Open source Enterprise-Level software with no commercial version. Originally forked from Nagios in 2009. Independent version "Icinga 2" since 2014 which was completely re-written from scratch with a new modern web interface. Icinng 2 can run any Nagios monitoring plugin
![]()
Zenoss Core is a free and open-source application, server, and network management platform based on the Zope application server. Zenoss Service Dynamics is the paid, enterprise version of Zenoss.
![]() Topbeat
Topbeat
Topbeat is a new open source shipper for per-process CPU, memory, and disk usage metrics to enrich with Logstash, search and analyze in Elasticsearch, and visualize in Kibana. It is akin to running a distributed “top” command on all of your infrastructure components, with results seamlessly collected, analyzed, and presented in a centralized manner.
https://www.elastic.co/products/beats/topbeat
Log Analytics
Splunk is a leader in the Log Analytics space, but an open source tool like elastic has been seeing tremendous adoption recently. Have a look at Google Trend Analysis that shows interest over time for elastic versus Splunk

![]()
ELK stack from elastic (Elasticsearch, Logstash, Kibana)— designed to take data mainly from any source and search, analyze, and visualize it in real time, Elastic is helping people make sense of data. From stock quotes to Twitter streams, Apache logs to WordPress blogs. Elastic is the major open source competitor for Splunk.

Fluentd is an open source data collector, which lets you unify the data collection and consumption from different sources like applications logs, syslogs, and machine logs for a better use and understanding of data. Fluentd main competition in the open source is logstash from elastic.
APM
![]() Packetbeat
Packetbeat
Packetbeat is an open source project from elastic to provide real-time analytics for real end user, web, database, and other network protocols. It allows you to measure application latency, helping you troubleshoot response times, monitor SLAs and application errors without instrumentation or logging. Packetbeat is a new promising project even though it does not meet the true APM capabilities as defined by Gartner.
https://www.elastic.co/products/beats/packetbeat
Dashboarding
![]()
Architected to work with Elasticsearch, Kibana gives shape to any kind of data — structured and unstructured — indexed into Elasticsearch. It also benefits from Elasticsearch's powerful search and analytics capabilitie.
https://www.elastic.co/products/kibana
![]()
Grafana is most commonly used for visualizing time series data for Internet infrastructure and application analytics but many use it in other domains including industrial sensors, home automation, weather, and process control. It supports Graphite, Elasticsearch, Prometheus, InfluxDB, OpenTSDB and KairosDB out of the box. Or use the plug-in functionality to add your own

